Sometimes, it is nice to lean on another expert for meteorological insight. Let’s go to Brian Brettschneider, Alaskan climatologist for some analysis.
Thanks, Brian!
from Victoria-Weather
Sometimes, it is nice to lean on another expert for meteorological insight. Let’s go to Brian Brettschneider, Alaskan climatologist for some analysis.
Thanks, Brian!
As we noted a couple of days ago, the tropics have been active very early this season, and now, it appears as though the Gulf of Mexico will offer up it’s first tropical storm of the season. Tropical Depression Three is churning in the Bay of Campeche, as seen here on satellite.
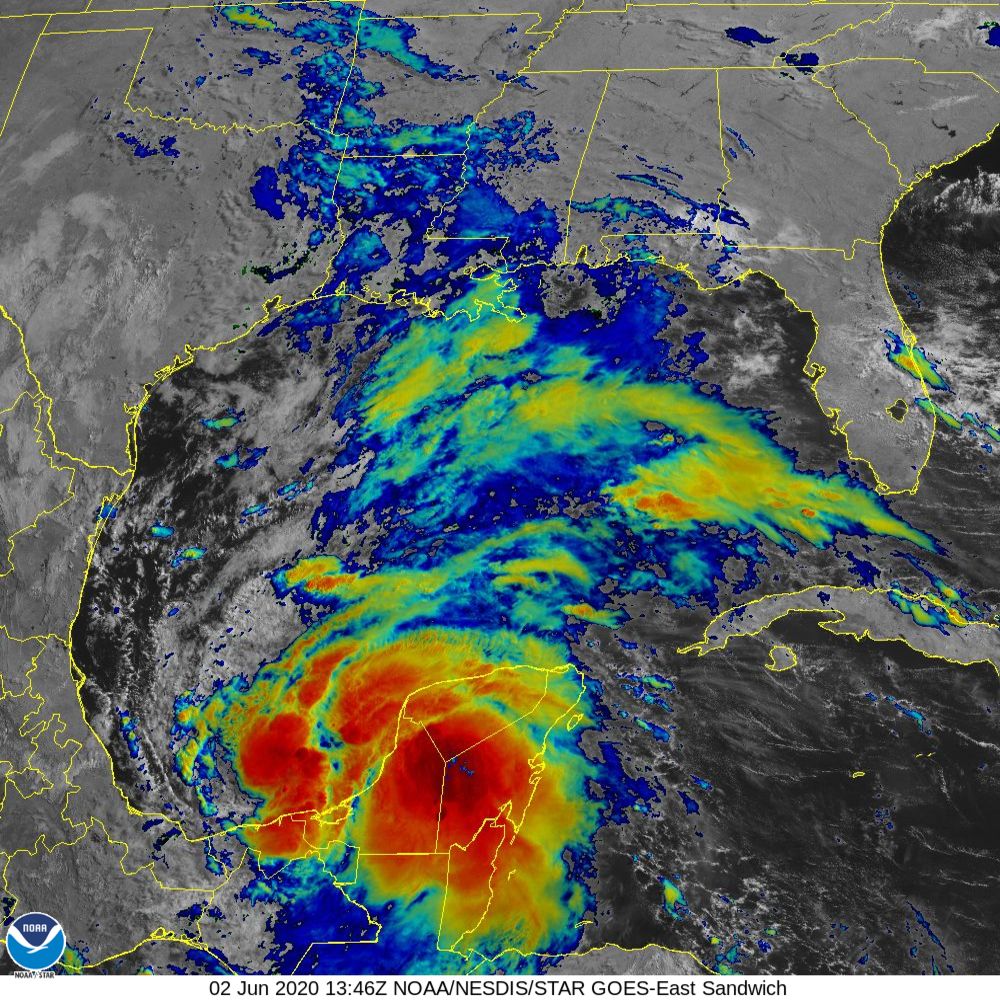
The circulation is just off shore, even as the primary area of convection is quite visibly over the Yucatan Peninsula. This is important, because this will allow the storm to continue to intensify. Models anticipate an intensification to a tropical storm — Cristobal — perhaps even this morning.
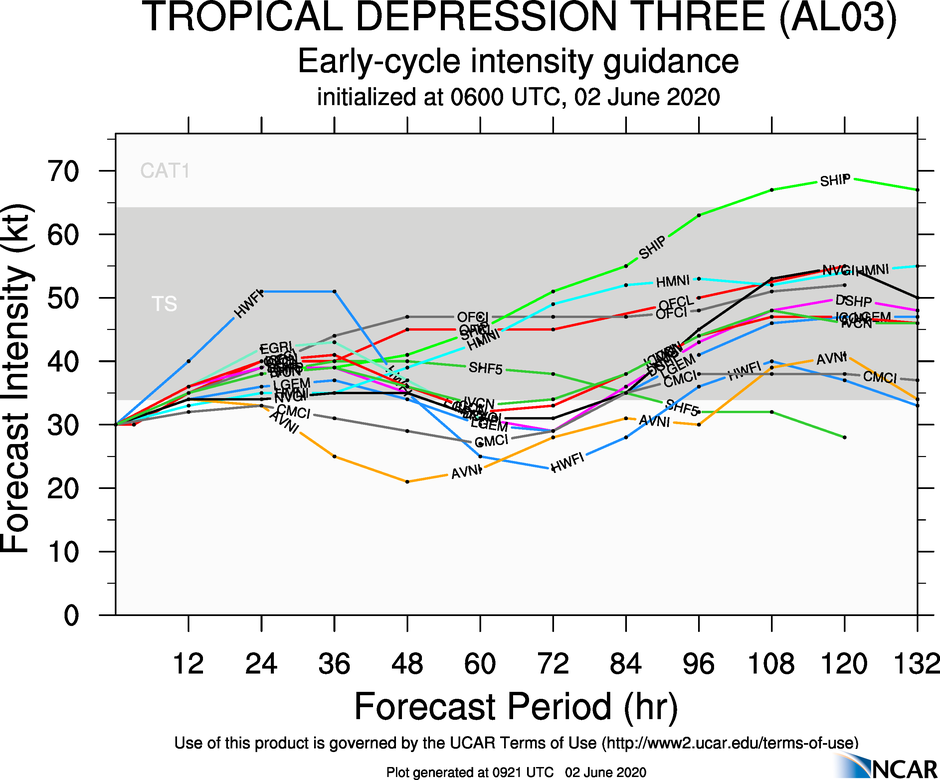
Spaghetti plots have a tendency to underestimate the peak intensity of tropical features, which means that I and many other outlets believe that this storm may even reach hurricane status as it drifts to the Gulf Coast.
It’s still going to go through a period meandering through the Bay of Campeche before it starts to drift towards the Louisiana Bayous, which means there is still a great deal that is unknown. For the time being, this is what the forecast spaghetti plot looks like.
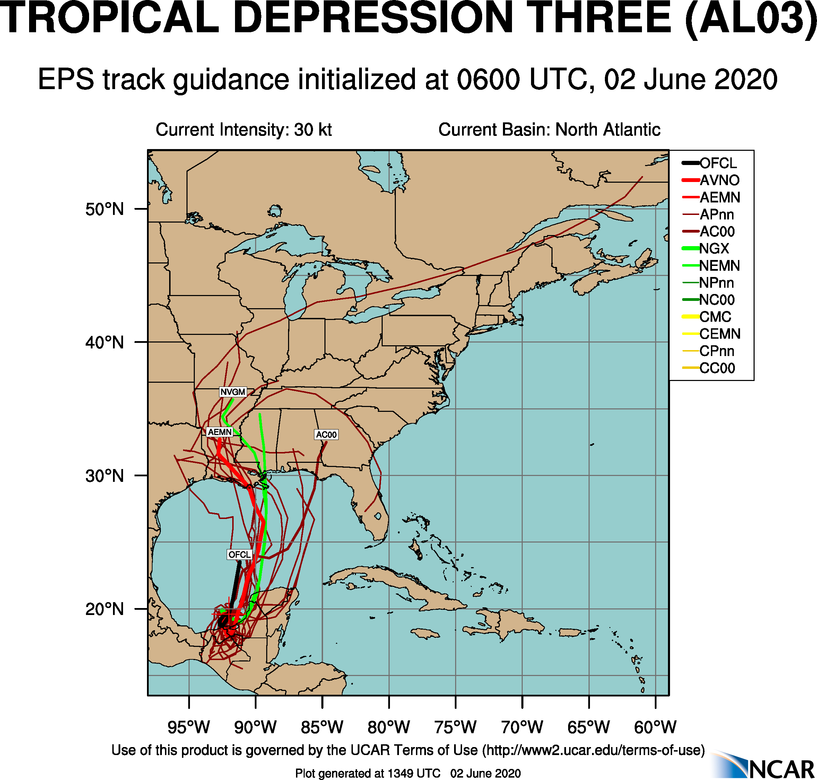
The potential for heavy rain will be the primary concern for coastal residents as the storm approaches, though wind and isolated tornadoes are always possible with tropical features.
After a busy forecasting month in April, we slowed down a bit in May to cover a lot of the other news stories (and write up a lot of road trips) for spring time. Maybe it was this relaxed pace that was taken, but Victoria-Weather ended up with the top spot for the month, a refreshing change of pace after April.
| Outlet | Month wins |
| Victoria-Weather | 1 |
| Forecast.io | 1 |
| The Weather Channel | |
| Weatherbug | |
| WeatherNation | |
| National Weather Service | |
| Accuweather |
| Outlet | Month wins | year wins |
| The Weather Channel | 6 | |
| Victoria-Weather | 1 | 5.75 |
| Weatherbug | 5.16 | |
| WeatherNation | 3.41 | |
| National Weather Service | 3.08 | |
| Forecast.io | 1 | 2.33 |
| Accuweather | 2.25 |

June 1st is recognized at the beginning of hurricane season, and I suppose, if you look at it through that lens, we’re still doing just fine! If you are of the belief that it is the beginning of tropical storm season, then boy, have we jumped the gun.
Every once in a while, and with increasing frequency, the NHC labels a tropical storm, or more typically, a subtropical storm, usually along the Gulf Stream or in the Gulf of Mexico, in May or even April. This is a function of a warmer ocean, but more directly, a relatively recent change in attitude towards naming subtropical storms.
But having two named storms come and go before we even reach June? That’s pretty wild. And there is another storm hanging out in the central Atlantic, with a 50% chance of developing into a tropical feature this weekend.
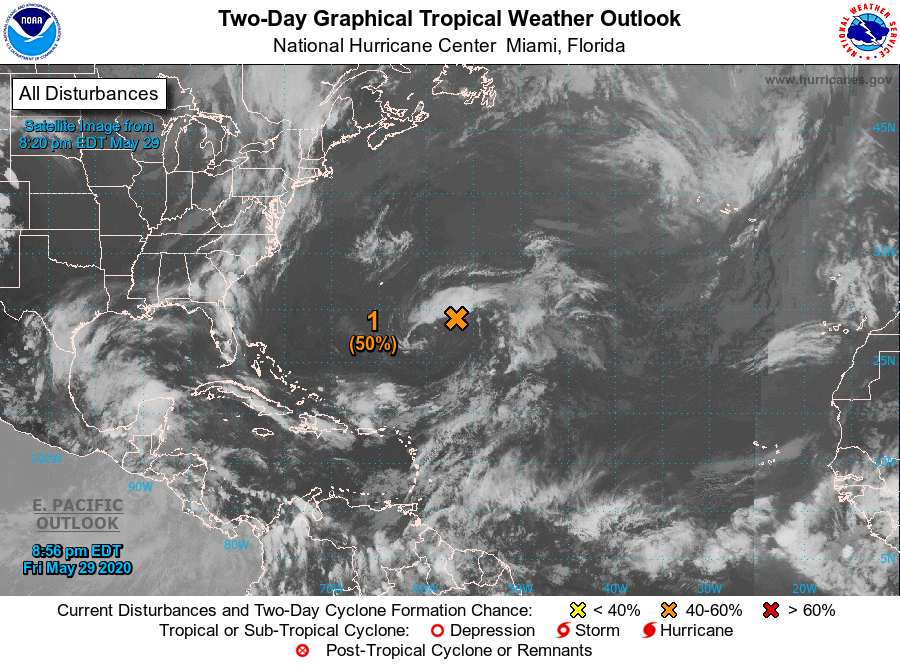
Both Arthur and Bertha spiraled along the East Coast, with Bertha bringing heavy rain to the Carolinas and New England. If the storm presently in the Atlantic does get named, it would be the first of the true Hurricane Season, and would be named Cristobal.
The storm is expected to wander due north, thanks to a disturbance presently seen on the East Coast, with a chance for a landfall over western Newfoundland early next week. It’s too early to say if this foretells the season to come, but boy, it does seem ominous.
After several days of severe weather blanketing most of the country, with particular emphasis on the High Plains, the Ozarks and the Carolinas, we are able to focus on just one area in the country, and as luck would have it, it’s the part of the country that I live in.
Low pressure over southern Canada is being undercut by a wave moving north out of Iowa. The nature of this pattern was hard to perceive in the long term by model guidance, and suggests that the nasty weather set up will not be long lived. With all that said, the SPC circled back and posted a slight risk along the Mississippi Valley for today anticipating rough weather.
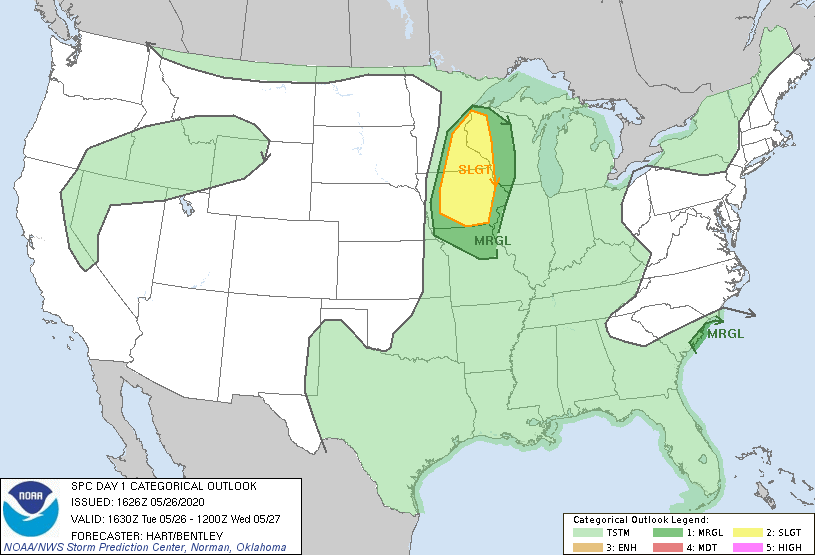
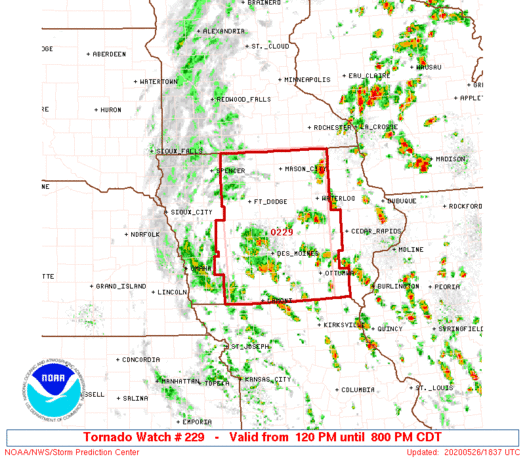
Given the nature of the system, a big of circulation being drawn towards a deeper area of circulation, the primary threat will be tornadoes, though hail and wind will be a concern as well. The threat for tornadoes has already prompted a watch box in Iowa, which has verified with a confirmed tornado west of Des Moines.
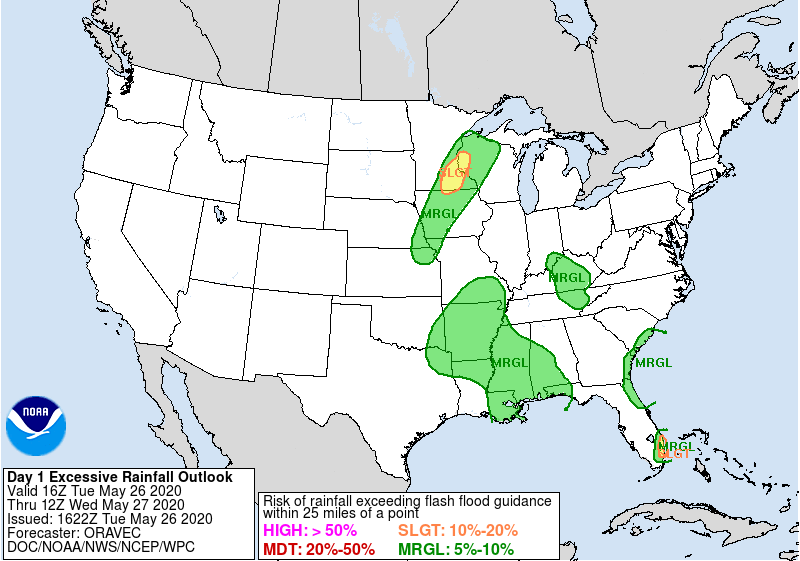
But it’s not just tornadoes that will be a threat. There is a risk that some of the rain fall, particularly in southeastern Minnesota, cold be torrential, and lead to some flash flooding. Below is the WPC heavy rainfall forecast.
As the storm matures, rain will blanket the region, with some regions of stronger updrafts and heavier rain. Here is the HRRR showing the arrival in St. Paul just before 6pm tonight, and looking somewhat ferocious when it arrives.
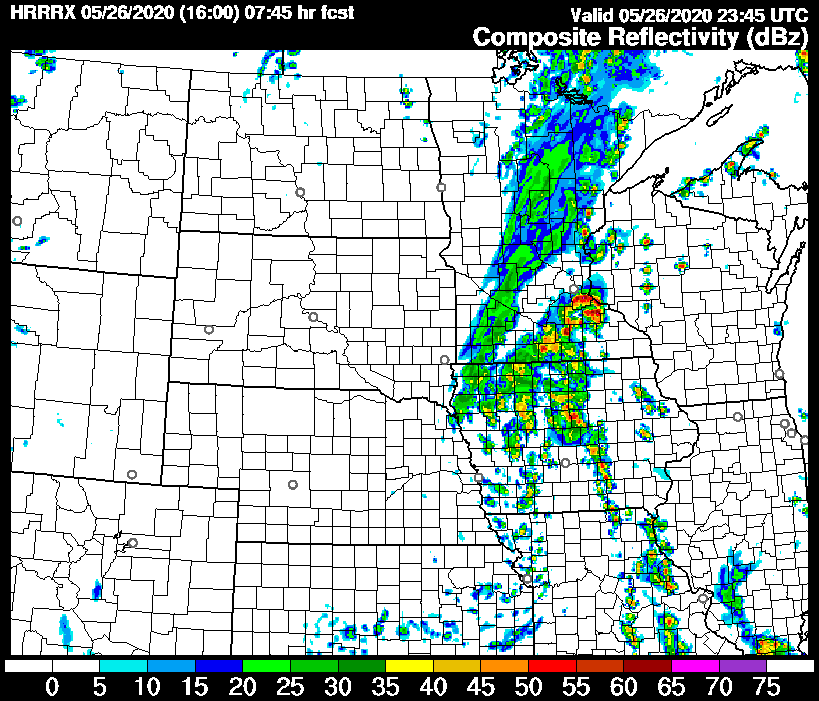
The heavier rain will continue even after the initial rounds of strong thunderstorms, making for a long, wet night from Des Moines to the Twin Cities.
It’s a real spring evening out there. Heavy thunderstorms are popping up in a couple of different areas, from New England, where severe weather has been reported all day from western New York to Massachusetts and New Hampshire. The primary severe component has been gusty winds.
New England storms aren’t usually good for radar imagery, but particularly with this squall, as the Boston radar is down for maintenance. There just isn’t a good way to look at the squall.
On the other hand, look at this iron curtain in west Texas.
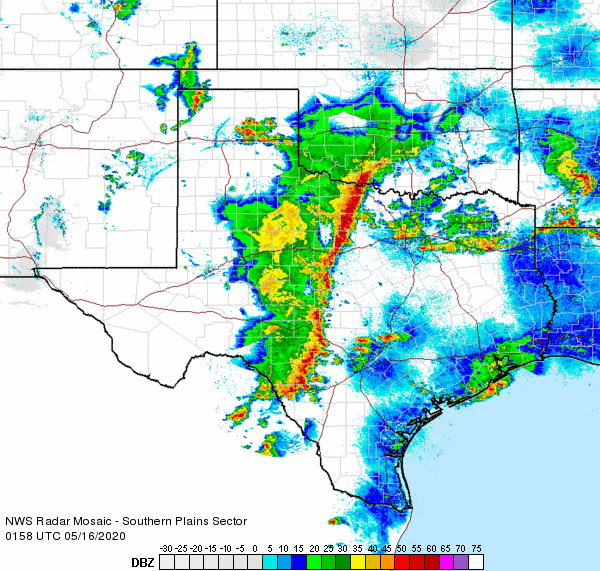
That impressive ling of nearly solid red stretches from east of Wichita Falls to east of Del Rio, bringing strong winds, and a nice batch of cooler drier air behind it. Sharp differences in air mass often show up more impressively on radar, and that’s what we have here.
If this line can hold together as it moves eastward, strong winds loom for cities along I-35 like Dallas, Austin and San Antonio. Hail would only come in small bursts, and the tornado threat that had once been there is now becoming less likely, though there could be a spin up in the scud out ahead of the primary line.
This might be a noisy night for a lot of people in Texas, and the storm system is going to slow down, so east Texas will feel the bumps later in the weekend. By the time the storms wrap up, though, Texans should feel a little bit of refreshing air for a day or so.
Maybe it’s because we have spent so much time at home, but we got through a lot of forecasts in April. I prefer reviewing those months, because we really get a taste for how successful everyone was. This month, it was even a fairly close race, letting us know there were some good forecasters last month. In the end it was Accuweather who grabbed the top prize for the month. Let’s look at the individual wins, though.
| Outlet | Month wins |
| Accuweather | 2 |
| National Weather Service | 1.83 |
| The Weather Channel | 1.5 |
| Weatherbug | 1.33 |
| Forecast.io | 1 |
| WeatherNation | 0.33 |
| Victoria-Weather |
That brings us to the totals for the year.
| Outlet | Month wins | year wins |
| The Weather Channel | 1.5 | 6 |
| Weatherbug | 1.33 | 5.16 |
| Victoria-Weather | 4.75 | |
| WeatherNation | 0.33 | 3.41 |
| National Weather Service | 1.83 | 3.08 |
| Accuweather | 2 | 2.25 |
| Forecast.io | 1 | 1.33 |
With a commanding lead that, it should be no surprise that The Weather Channel is indeed in the lead for forecaster of the year. This month, though, kudos belong to Accuweather. Way to go!

Models have been in the news quite a bit over the last several weeks, in particular as they relate to the COVID-19 Pandemic. There have been a great deal of concerns and questions as they relate to scientific modeling. I’m certainly not an epidemiologist, but meteorology is a field of science that relies heavily on modeling, so I thought I might share some insights.
Models, depending on the output desired, are essentially mathematical equations, in which variables are either solved for or assumed. The equations are given starting information, which is often altered, depending on observations, such as the temperature or barometric pressure in meteorology, or the case total or fatalities in a COVID model.
There is often discrepancy in the models versus what happens in real life because variables can be uncontrolled. In the case of the weather, the limited number of observations means there are gaps in information that are assumed, but not confirmed, which can lead to errors, especially over time.
The same can be said with COVID modeling, however the assumptions are based on how people will respond. The primary difference, at this point, between the various COVID models is assumptions based on how government ordered social distancing is instituted and remains in effect. One of the uncontrolled variables is how engaged in the population is in the social distancing, as the models only respond to the virus’s known rate of spread and mortality.
Models are only as good as the information that goes into them, but at the very least, they are effective at demonstrating trends, and giving an idea generally, if not always specifically, of the future. They can inform of responses of changes in variables. Weather models are updated regularly, and resubmitted with new data, with corresponding alterations to the forecast. COVID models are updated with new case numbers and new actions by the local populations and government.
Models exist to allow the public and the various powers that be to prepare and respond to pending conditions, whether they be thunderstorm or waves of illness. Unlike weather modeling, in which we are tasked with responding to the output, epidemic modeling allows us to alter the outcome with our actions, and are of particular value.
The last couple of years have seen April’s with historic late season snow storms that called into question the true definition of spring. This year, it’s bee significantly warmer, and dare I say spring like for a lot of the country. This as been with it’s negatives, of course, as the spring severe season has been particularly robust in the Southeast, but I think a lot of people are pretty pleased with how the weather has turned out in April.
The CPC would like to end your celebrating.

A large portion of the country, centered around the Great Lakes, is going to start May much cooler than normal. It probably won’t mean snow, but it shouldn’t be ruled out everywhere. Conversely, temperatures in the southwest, which have already been well above normal, are expected to continue to be significantly warmer than normal. Nobody is happy.
On the plus side, at least out east, is that cooler temperatures are more tolerable in May than they are in April. Additionally, cooler temperatures should help mitigate the severe season in the southern Plains. The first week of May has historically been a dangerous week in Oklahoma, but that doesn’t seem to be the case this year.
For warm weather lovers, the long range forecast isn’t great, but it could all certainly be worse.
Happy Easter everyone! I have to, before we get started, tell you all that tomorrow looks like a very dangerous day along the Gulf Coast. This might be the storm system that 2020 is remembered for, as it bears a strong resemblance to storms that have lead to devastation in Alabama and Mississippi in the past. We’re all at home, so be sure to listen to your local weather persons for guidance as weather gets dangerous.
We didn’t have that many individual forecasts last month during the course of the month, but for those that we did, there was a clear winner: The Weather Channel. The Weather Channel parlayed their win in March to a comfortable lead for the year, a quarter of the way through.
Lets look at the total wins for the month, and for the year.
| Outlet | Month wins |
| The Weather Channel | 2.5 |
| Victoria-Weather | 1 |
| Weatherbug | 0.5 |
| WeatherNation | |
| National Weather Service | |
| Forecast.io | |
| Accuweather |
| Outlet | Month wins | year wins |
| Victoria-Weather | 1 | 4.75 |
| The Weather Channel | 2.5 | 4.5 |
| Weatherbug | 0.5 | 3.83 |
| WeatherNation | 3.08 | |
| National Weather Service | 1.25 | |
| Forecast.io | 0.33 | |
| Accuweather | 0.25 |