Every ten years, weather averages are reconsidered and updated. Daily high temperatures, low temperatures and precipitation are now based on the most recent 30 years, reflecting the most recent information in our ever changing climate. In addition to the daily changes, monthly and seasonal changes are also instituted.
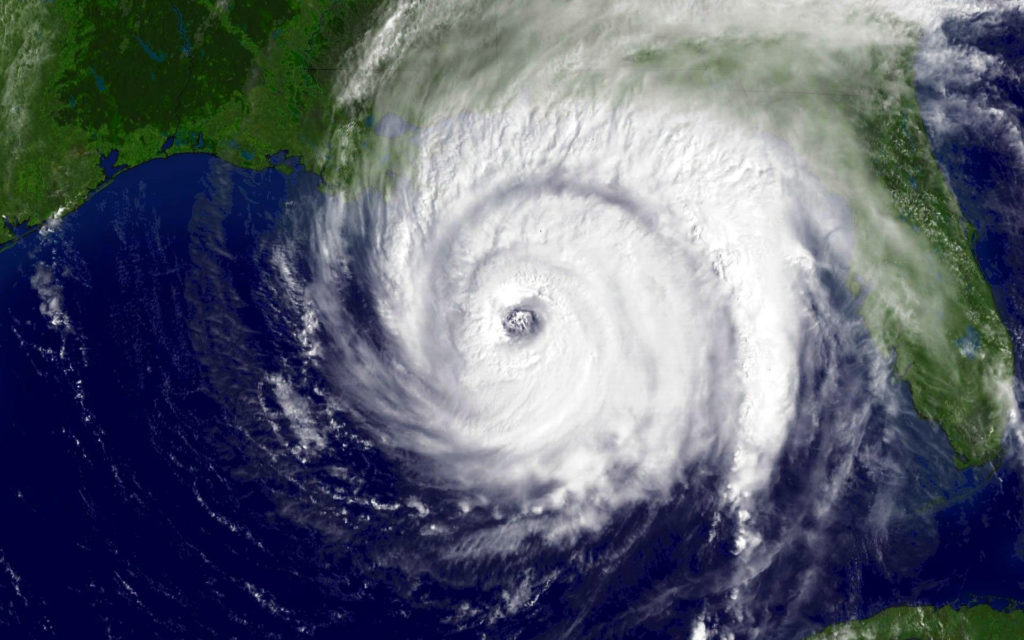
Hurricane seasonal averages were updated, replacing the 80s with the extremely active 2010s. Now, an average season will see 14 named storms, with 7 hurricanes, up 2 and 1 from the previous averages, according to the National Oceanic and Atmospheric Administration. This is has a lot to do with the active years early in the past decade, and especially the last several years, which were busier than even the new normal years.
There is something to be said about the warming of the north Atlantic, but also, the El Nino pattern, which was more prevalent in recent years. Somewhat surprisingly, the eastern and central Pacific didn’t have any revision to their annual averages. The Atlantic also didn’t see an increase to the major hurricane forecast.
Satellite data and naming conventions really were revolutionized in the 90s. Improved satellite data will, as a result, not be a factor in future changes to averages, but they may have led to some change in this update. Hurricane season, officially, begins on June 1st, and we are coming off the busiest season of all time.
